A public infrastructure census became a reusable evidence base.
VoxMapp helped turn thousands of field visits into a structured, geolocated picture that could be checked, compared and revisited.
- 2018–2020 · 24 months
- Developed in collaboration with independent monitoring and oversight partners.
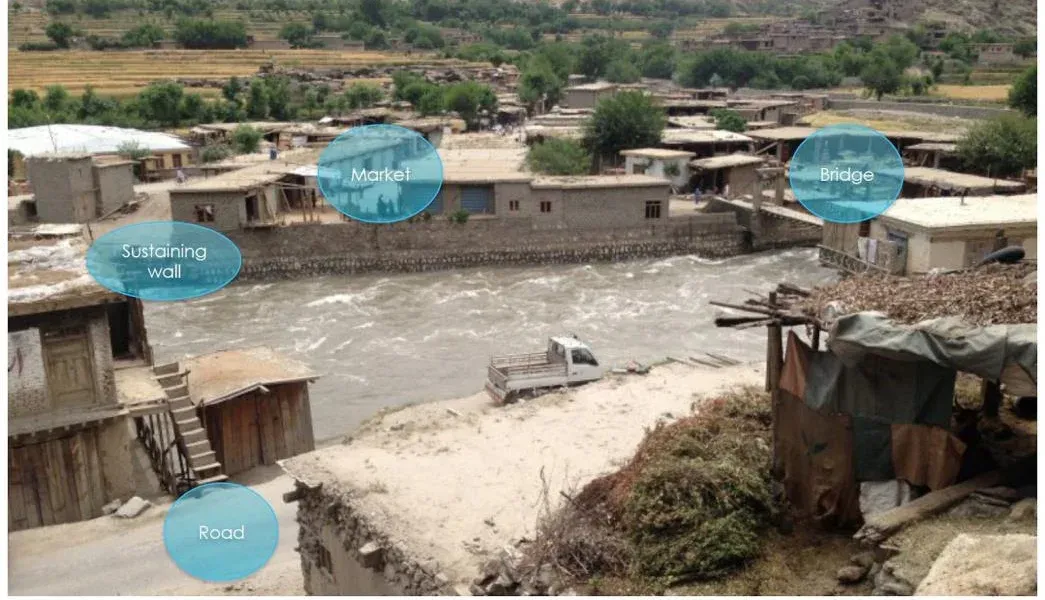
- 7,883
- infrastructures mapped
- 89
- enumerators
- 24
- months
- GPS + images + questionnaires
- plus water-quality tests and metadata
The real issue was the absence of a reliable reference.
Planning, maintenance and monitoring were constrained by information that could be incomplete, difficult to update, not precisely geolocated or disconnected from photographs and other evidence.
The operational question: Can very different types of public infrastructure be documented in a way that is precise enough for each site, standardized enough to compare, and structured enough to be updated later?
Each infrastructure needed more than a point on a map.
The data model was designed so each record could stand on its own and still be compared with other infrastructures.
One infrastructure record
- Pictures
- Inside, outside, condition, furniture and supporting documents.
- Geo
- GPS coordinates and altitude tied directly to the record.
- Time
- Construction dates and temporal information.
- Funding
- Sources of funding associated with the infrastructure.
- Supervision
- Entities responsible for construction and management.
- Questionnaire
- Standardized questions designed for cross-infrastructure comparison.
The collection process itself became visible and controllable.
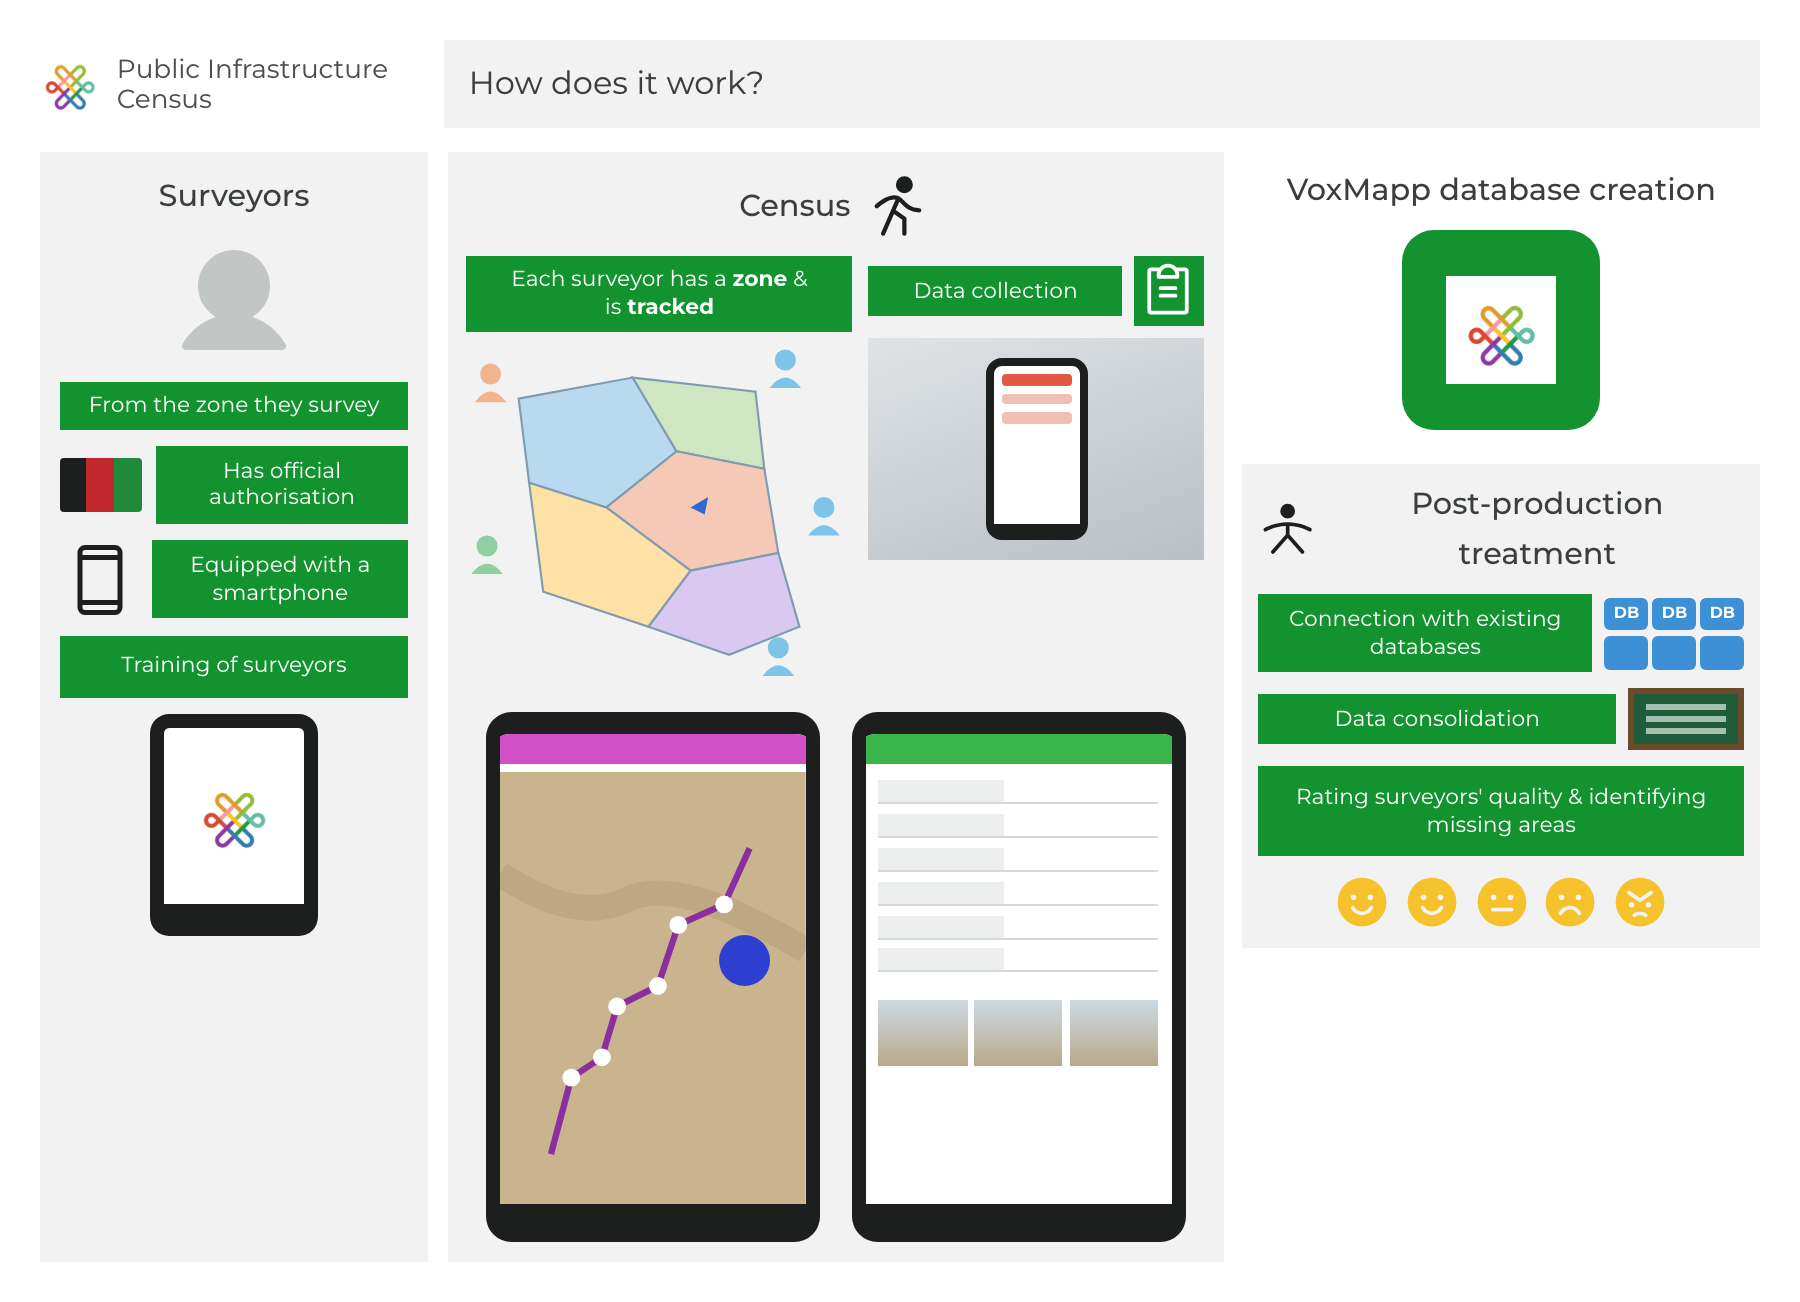
Train and assign.
A standardized four-day training prepared surveyors, then working areas were divided by enumerator.
Track coverage.
Routes, positions, speed and time spent in each place could be checked against assigned areas.
Build the record.
Each infrastructure combined structured questions, geolocation, photographs and supporting information.
Check quality while collecting.
Completion rates and unanswered questions could be reviewed by user and infrastructure to surface potential problems.
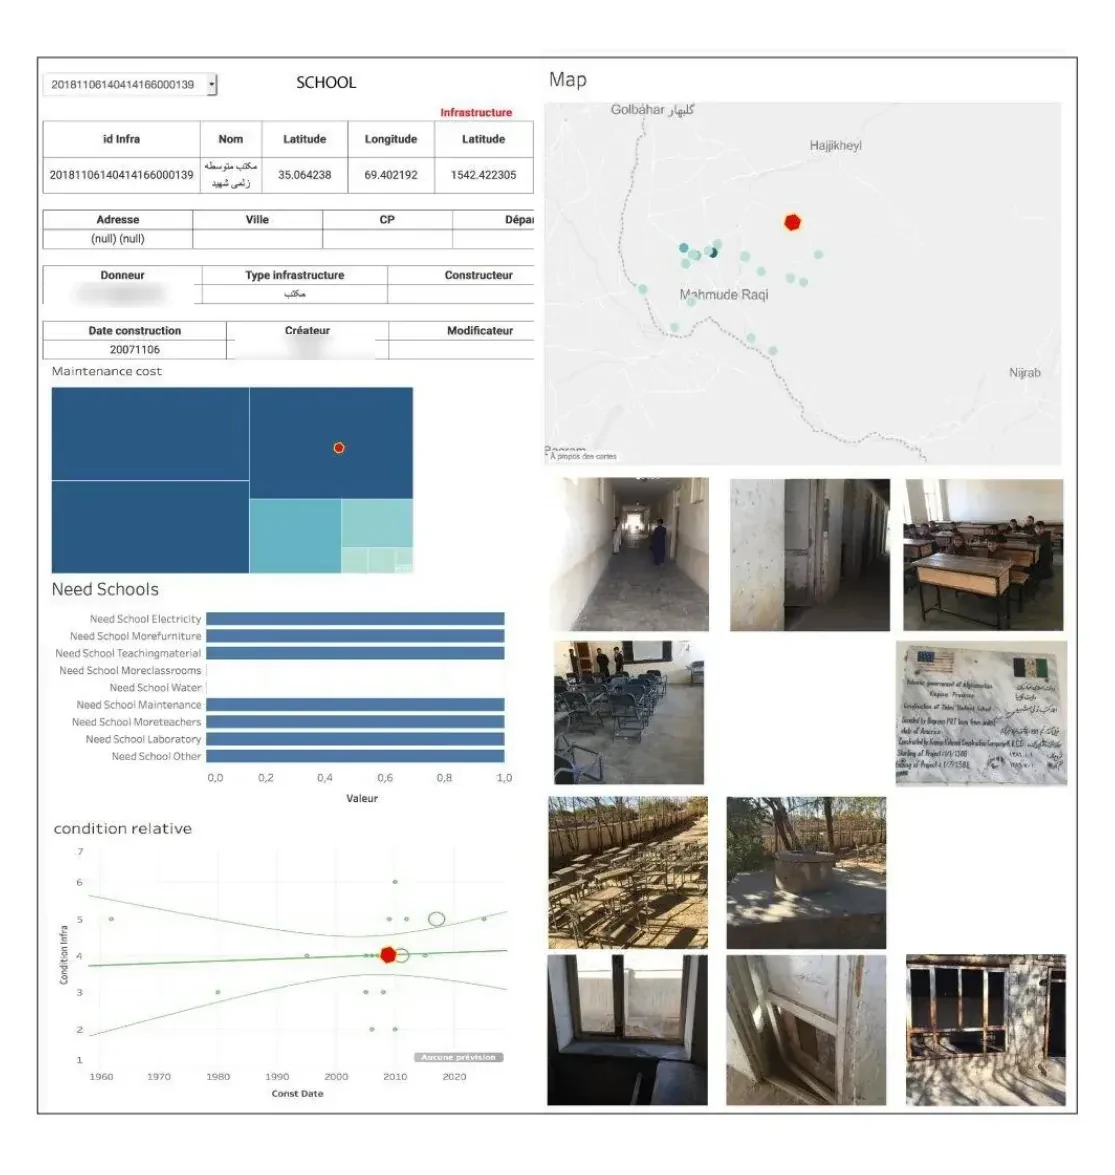
The evidence was visible before the fieldwork was finished.
Coverage, collection quality and the detail of each infrastructure could be inspected as part of the same working system.
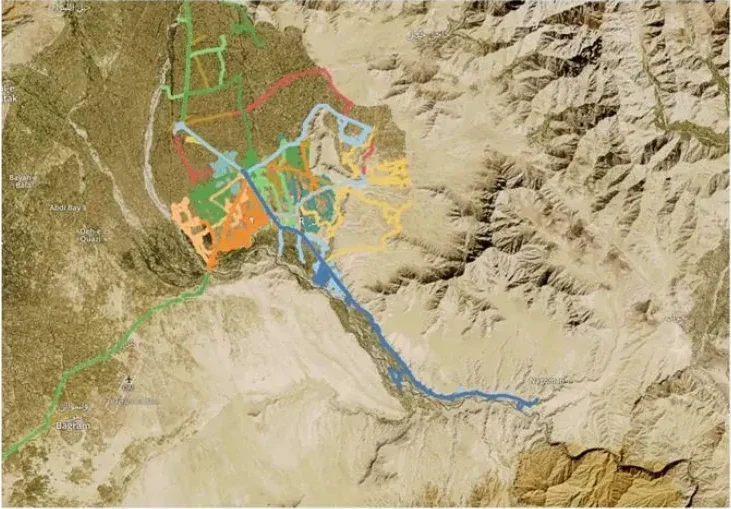
Where the teams had actually been.
Tracking data made uncovered areas and field trajectories visible, allowing work to be reassigned when necessary.
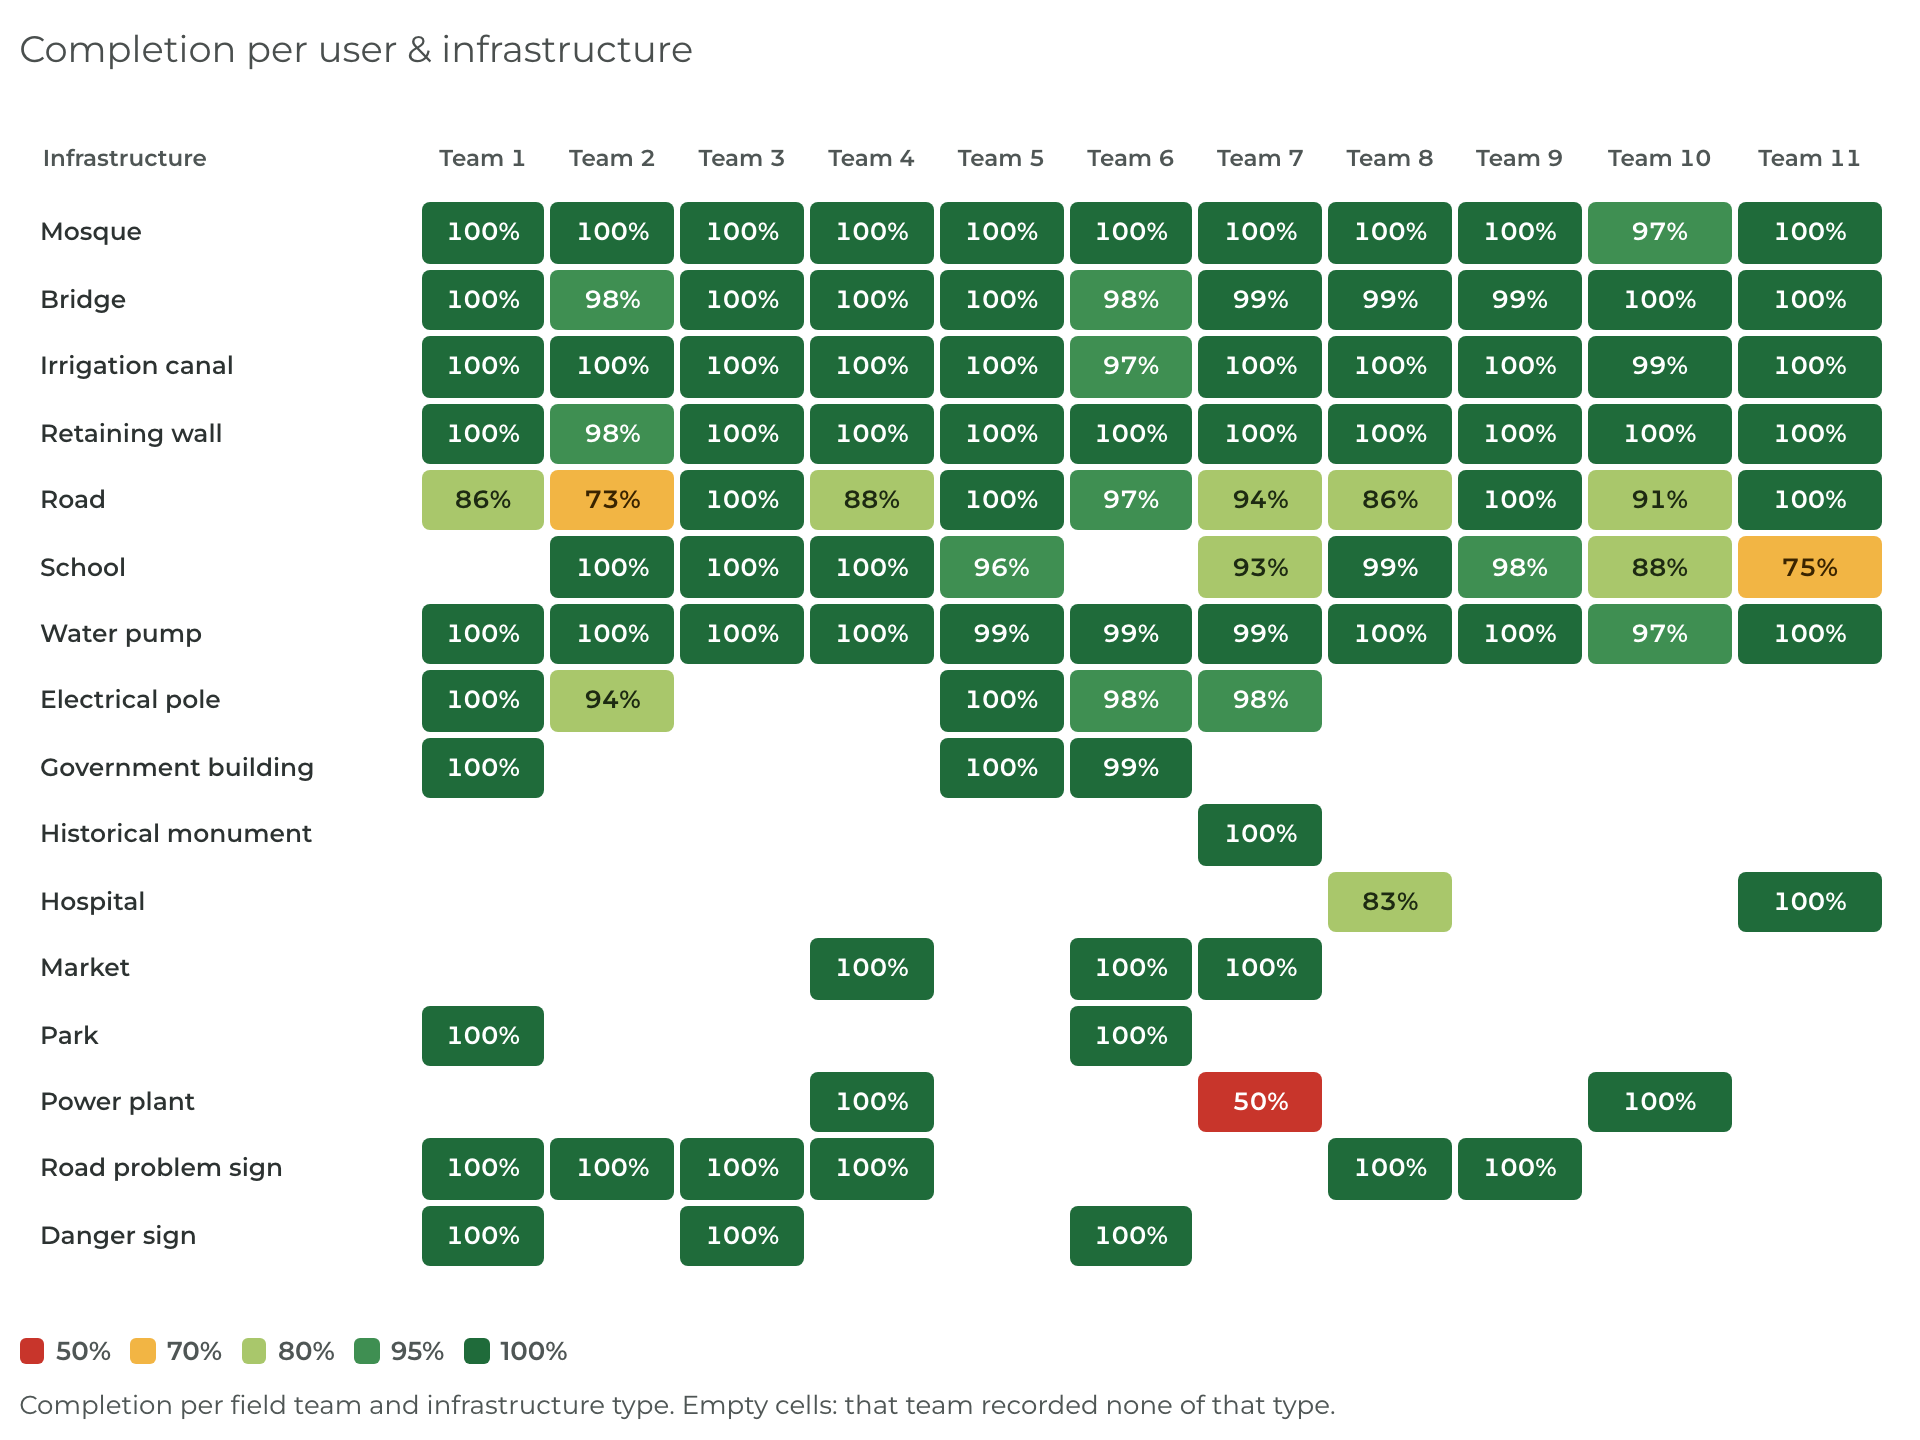
Where the records needed attention.
Completion rates could be inspected by user and infrastructure type so incomplete or unusual cases could be investigated.
A field visit stopped being an isolated event.
Inspect one place in context.
Open one infrastructure with its location, pictures, attributes and comparative indicators.
Compare across places.
Filter by type, year, condition or other structured attributes while keeping the same basis for comparison.
Return with new questions.
Later work can add new observations or test new questions without rebuilding the reference from scratch.
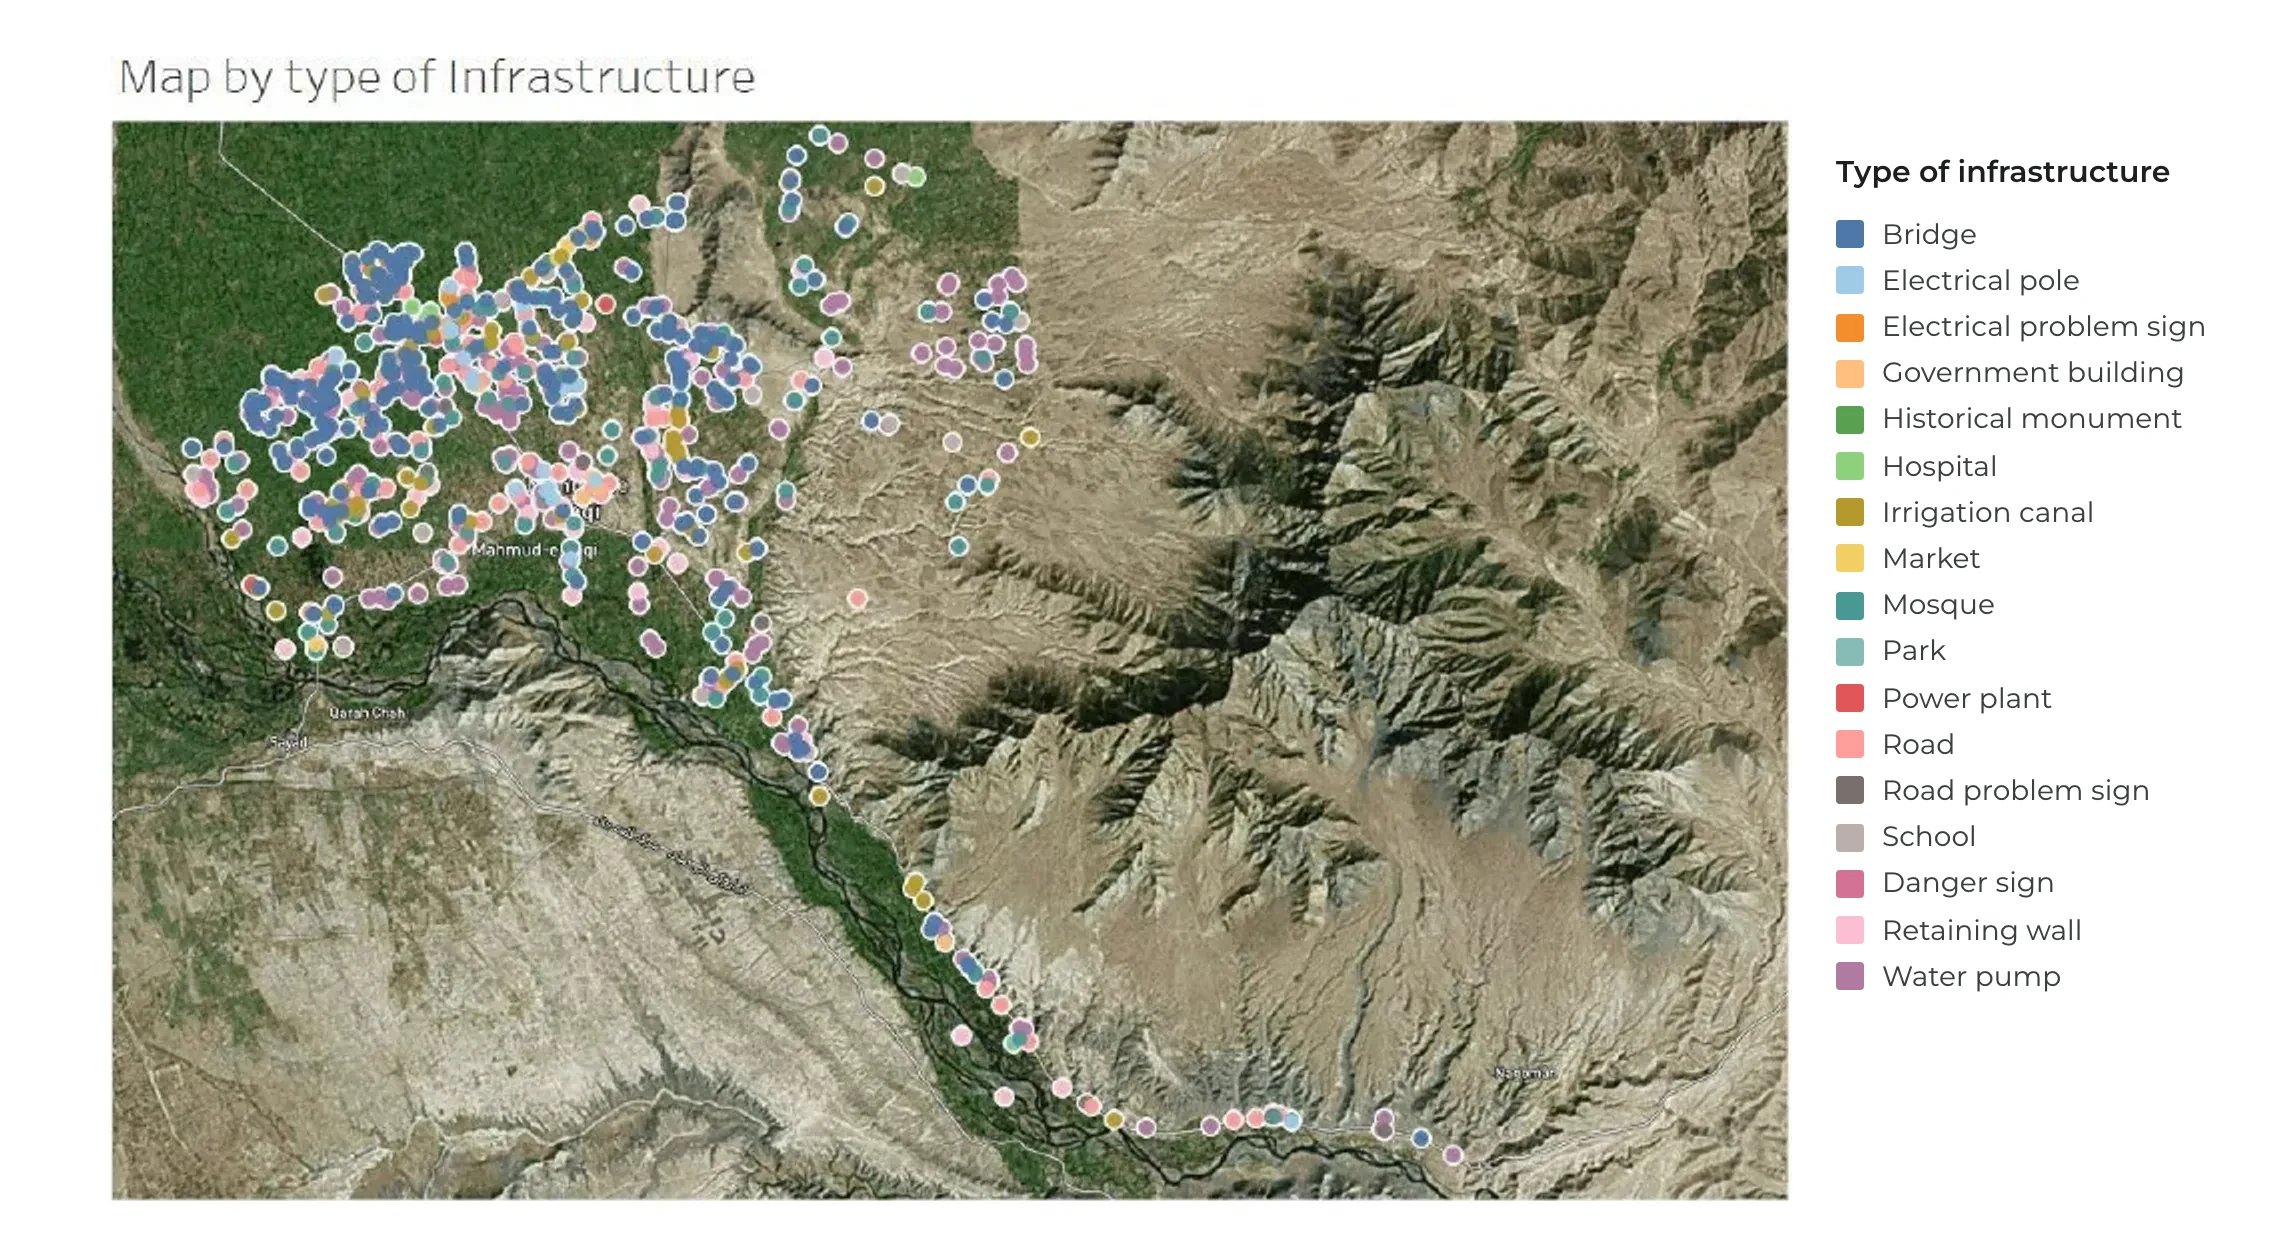
The census became a reference for questions that came later.
The first VoxMapp cycle created a structured reference. Later work could add observations, compare change and formulate new questions from what was already known.
A reliable picture exists.
Places, photos, coordinates and structured attributes already share a common frame.
New observations extend it.
Updates add to the same places, records and structure.
The picture gains history.
Repeated observations can be compared with what was already known, making change visible over time and across places.
New questions start from evidence.
The reference and its history are already there, so later work can test maintenance needs, water quality, access or new priorities without rebuilding the baseline.
The deeper loop builds on itself. The next cycle begins with the structure and history created by the previous one.
- Infrastructure maintenance
- Development needs
- Local budgeting
- Water quality
- Access & isolation
- Aid sustainability