Repeated monitoring turned a health-system snapshot into a timeline of change.
VoxMapp helped teams keep the same health-facility reference across successive monitoring rounds, making change visible.
- Longitudinal monitoring
- Facilities, observations, field evidence and dashboards connected across repeated waves.

- 1,345
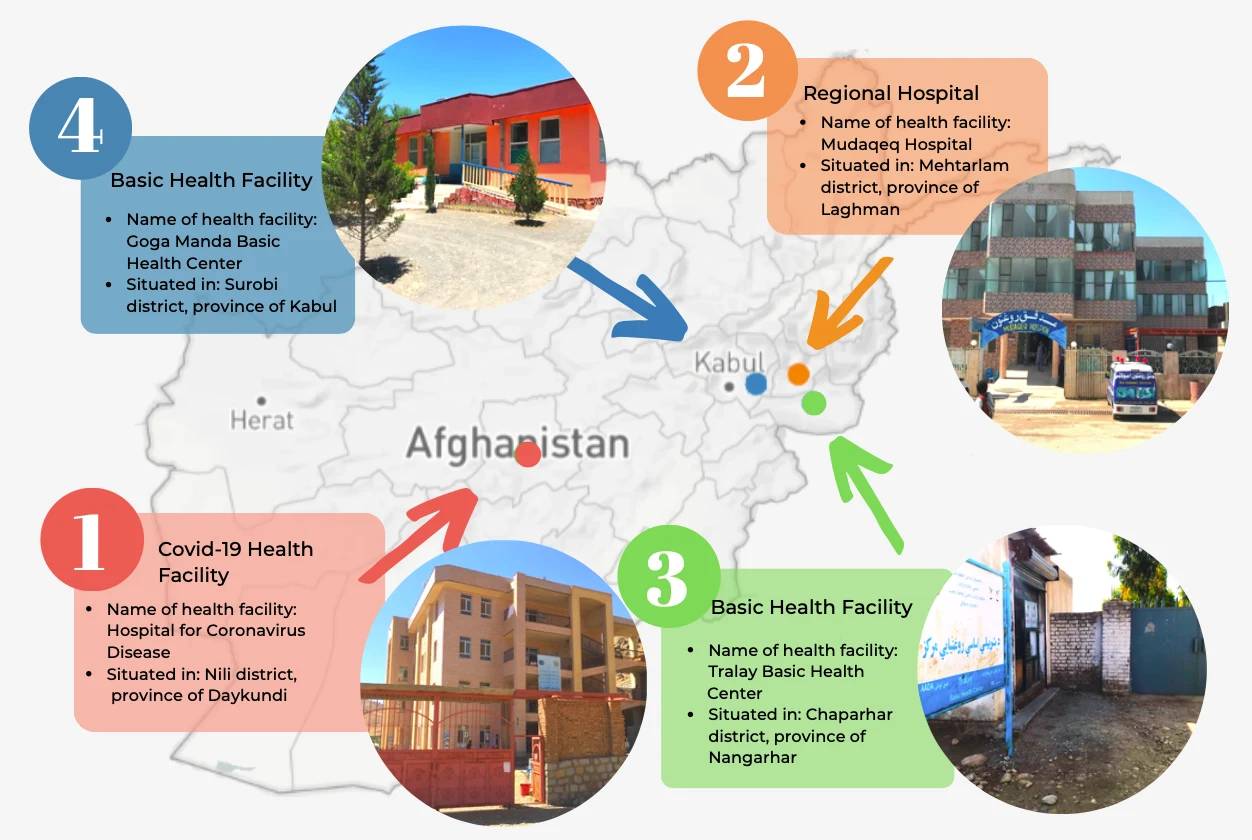
- health facilities mapped and followed
- 6,000+
- interviews gathered across waves
- 14
- interactive dashboards
- Repeated waves
- one reference reused over time
One visit describes a facility. Change needs repeated visits.
Services, resources and operating conditions can change from one period to the next. If every monitoring round is treated as a new exercise, the context needed to interpret that change is repeatedly lost.
The operational question: How can a distributed health system be monitored repeatedly while keeping each facility comparable to itself and to the wider system?
Each wave had to refer to the same operational reality.
The value came from keeping a stable reference while allowing new observations to be added over time.
One health-facility reference
- Facility
- A persistent health-facility reference, kept across every round.
- Place
- Location keeps observations anchored to the same operating context.
- Wave
- Every observation retains the period in which it was collected.
- Services
- Service availability and operating conditions can be revisited on the same basis.
- Resources
- Resources and support remain related to the same facility and period.
- Evidence
- Field observations and dashboard views remain connected to the reference they describe.
Monitoring became a repeated operating process.
Return to the same reference.
Facilities remain identifiable across monitoring rounds.
Add a new observation.
New field information extends what is already known.
Keep time attached.
Each round becomes part of a sequence.
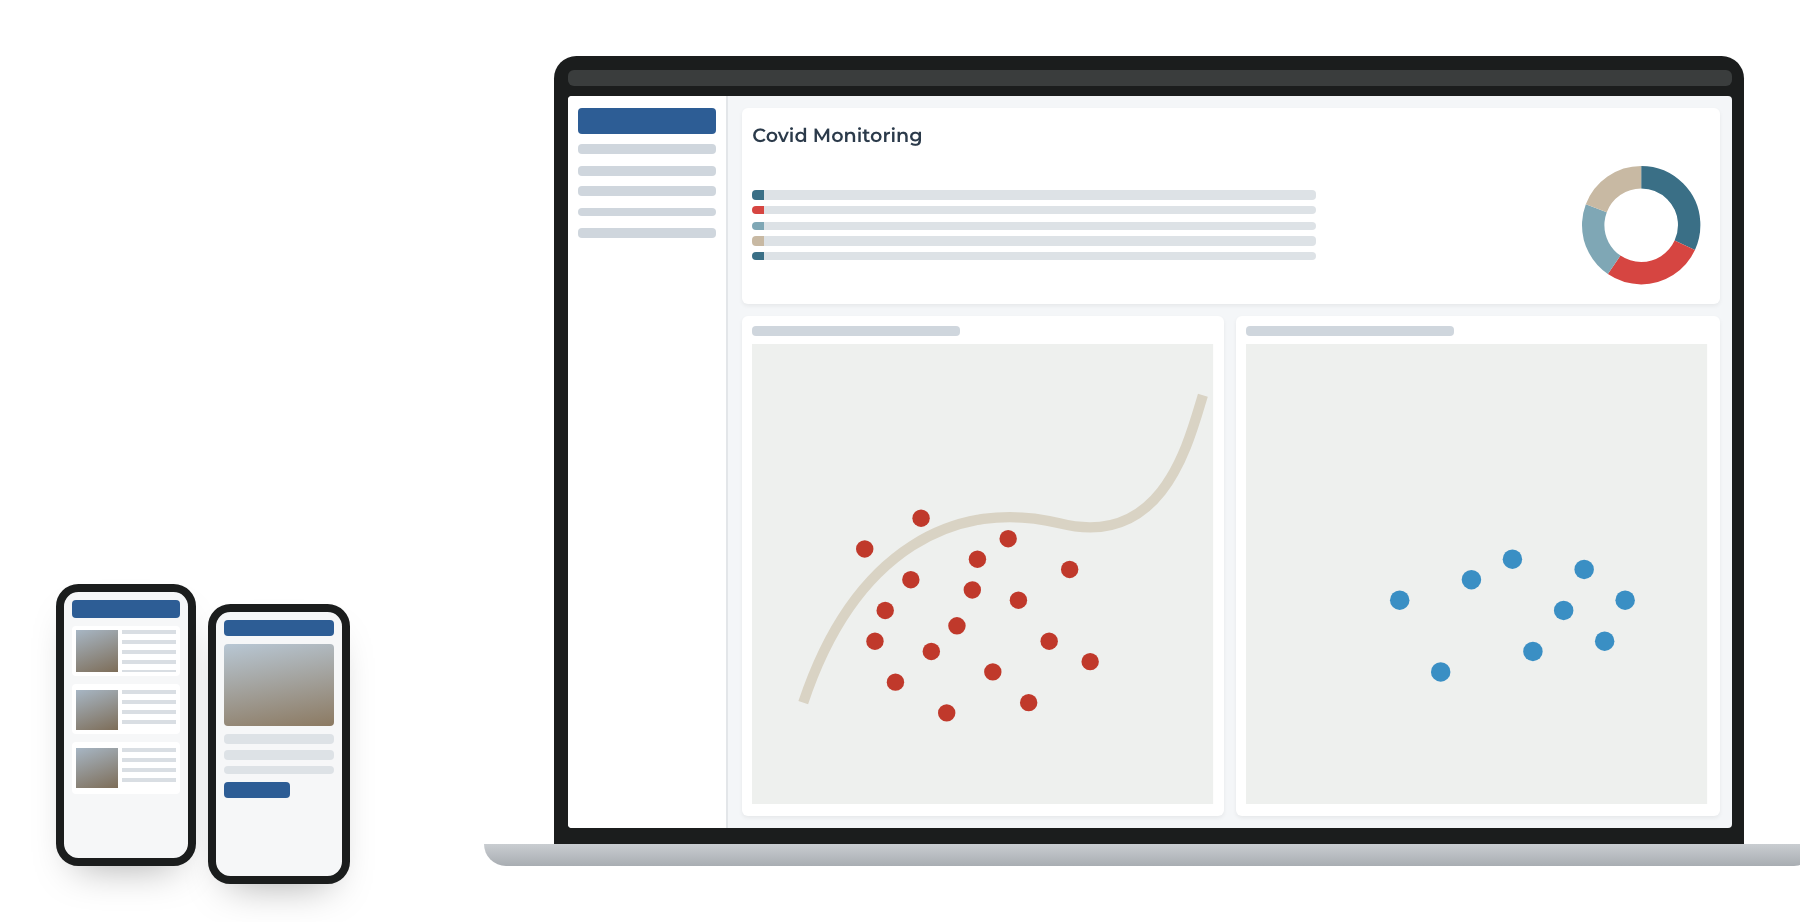
Update the shared view.
Dashboards make the latest picture available while earlier observations remain meaningful.
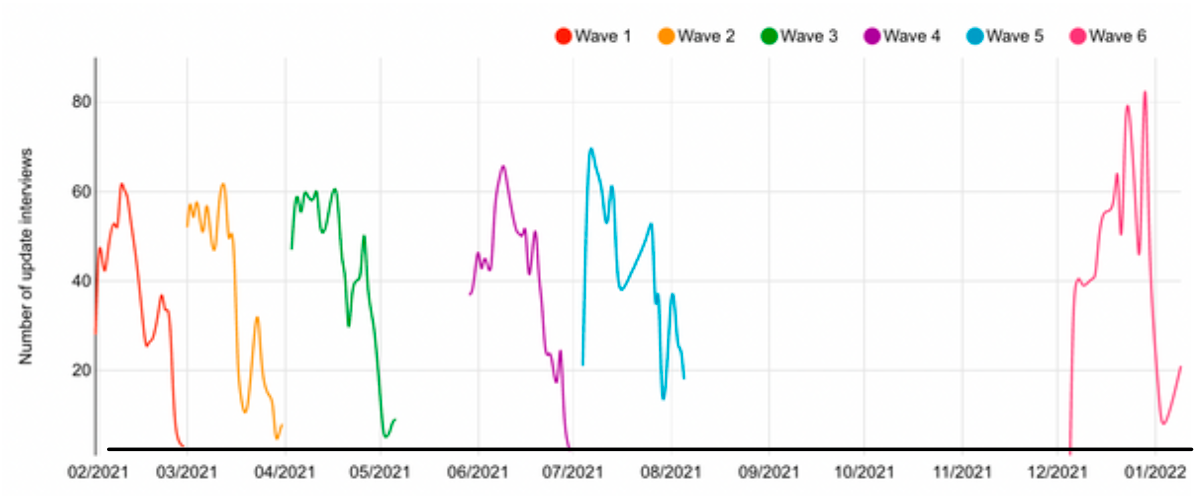
The important evidence was the movement between waves.
Keeping the reference stable allows the same facility or system to be read at different moments.
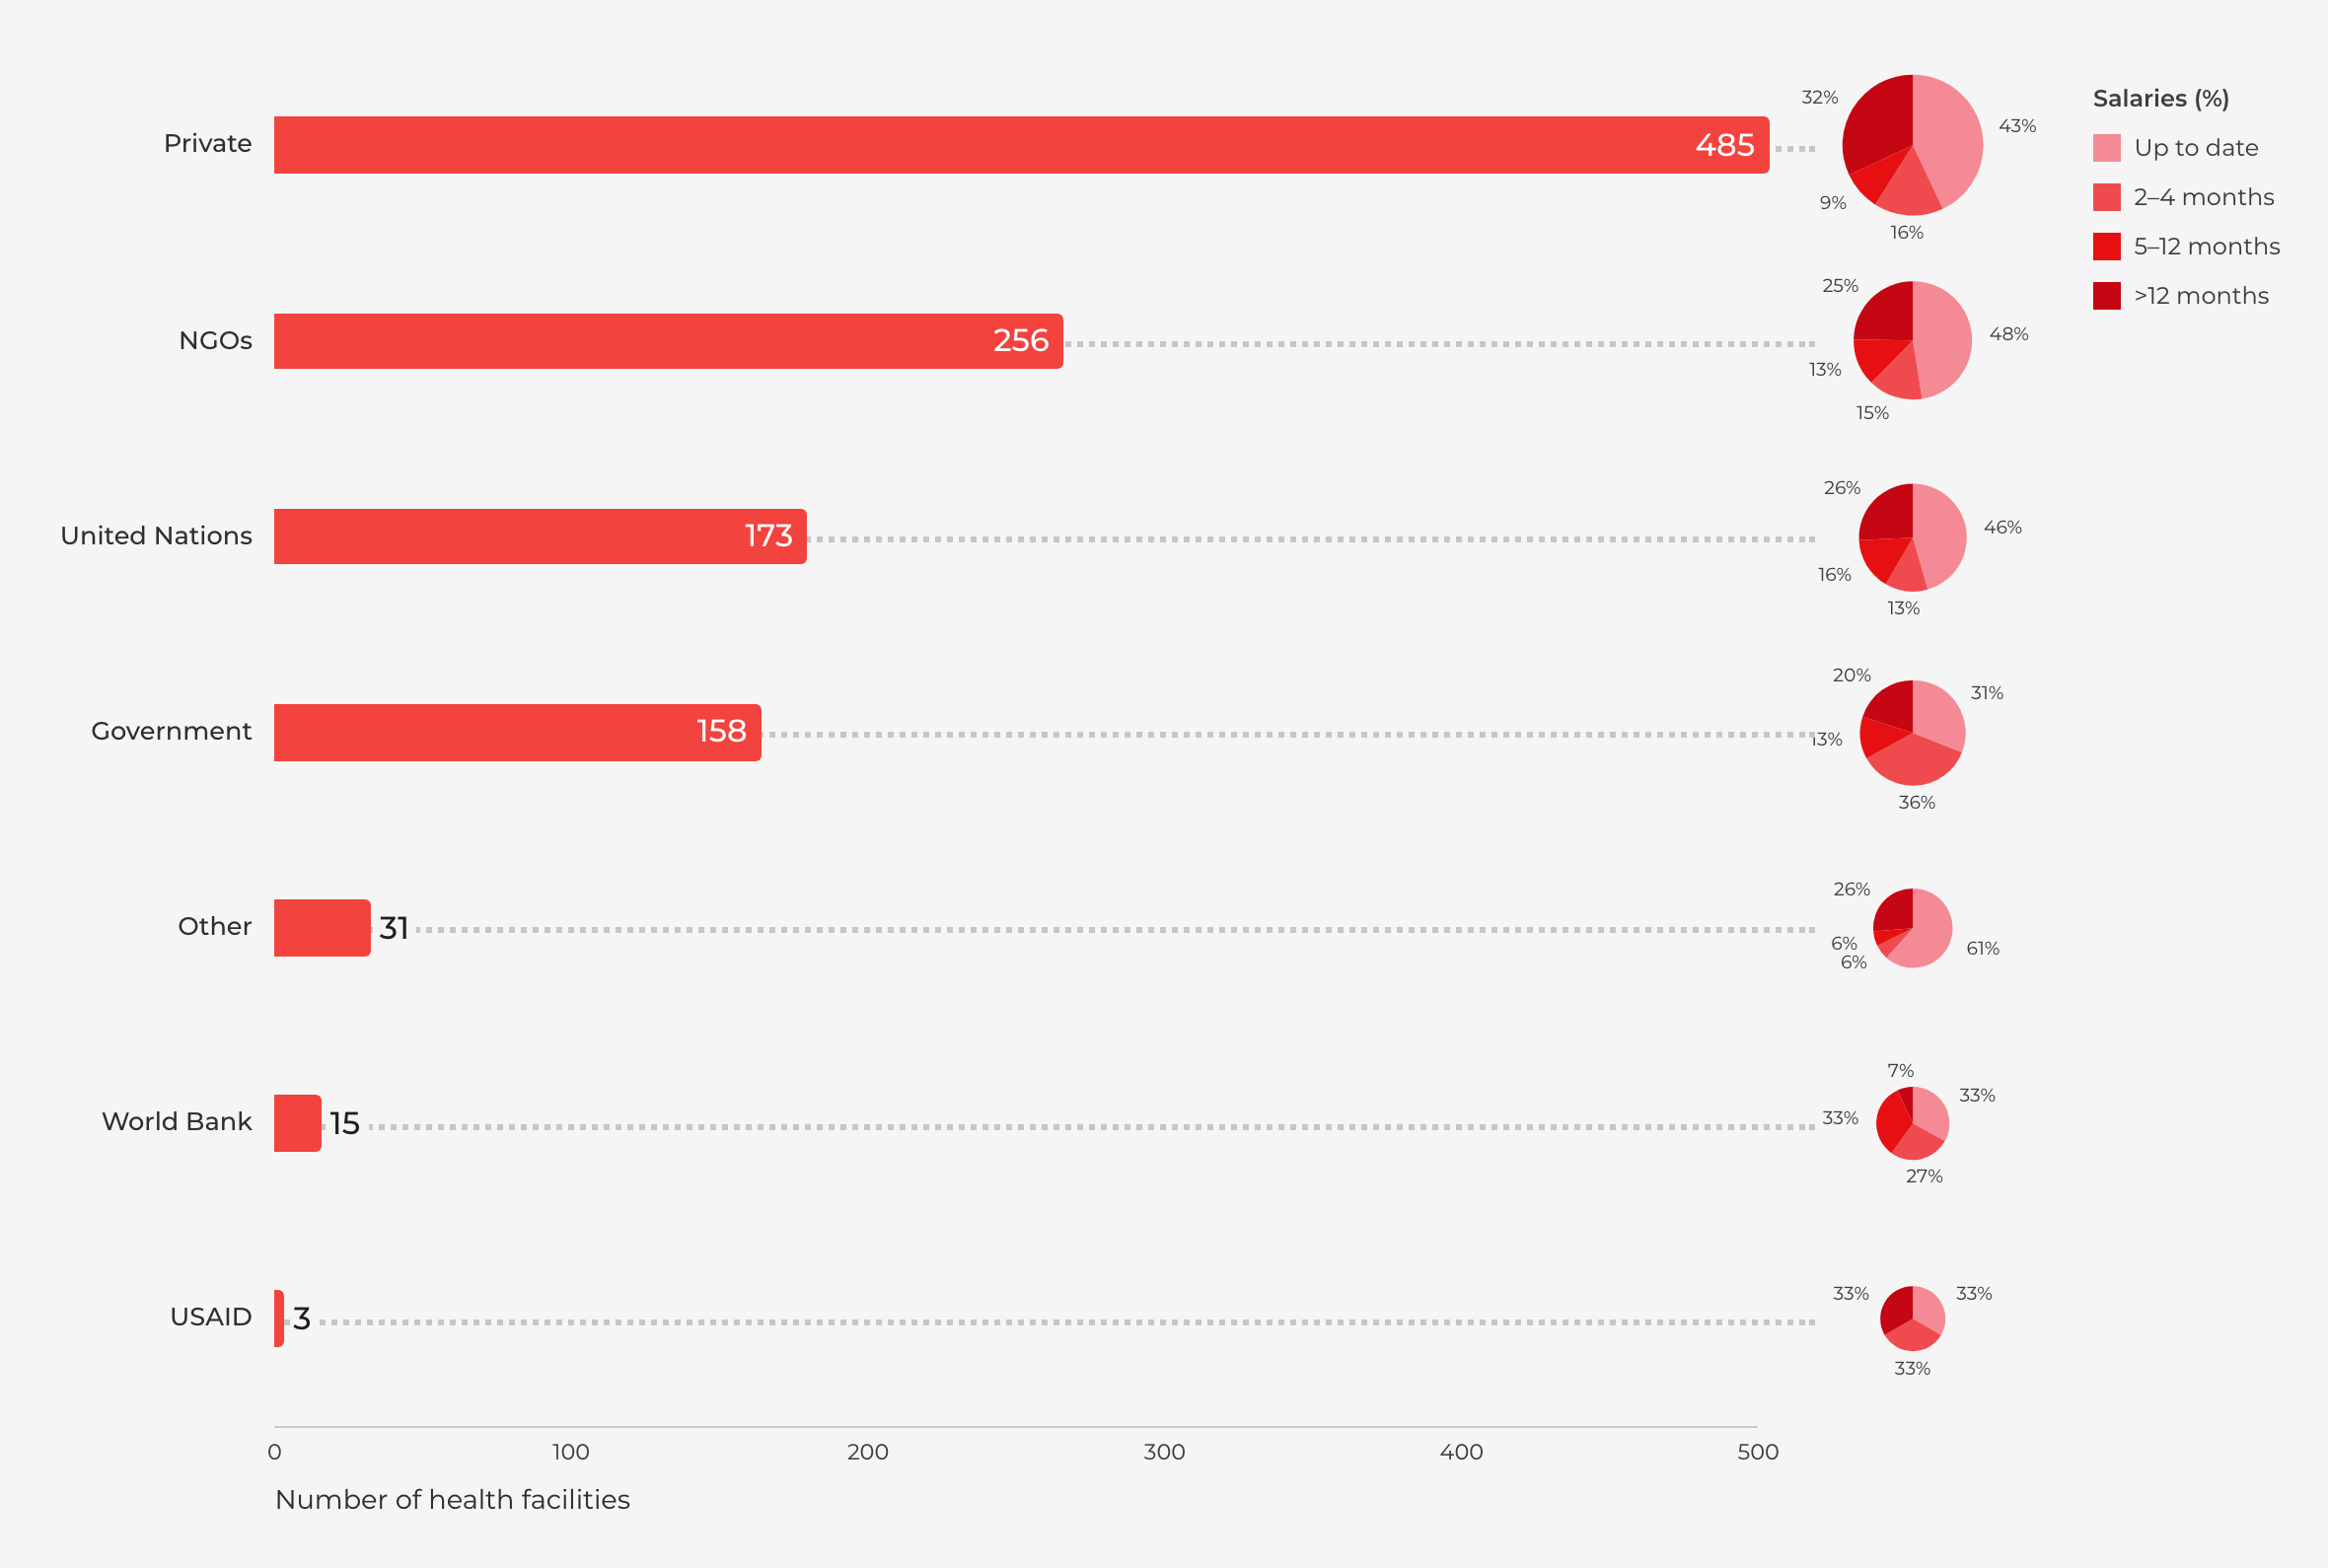
Staffing conditions could be read by institution.
Facilities were compared by the institution paying their staff and by how recently salaries had been received.
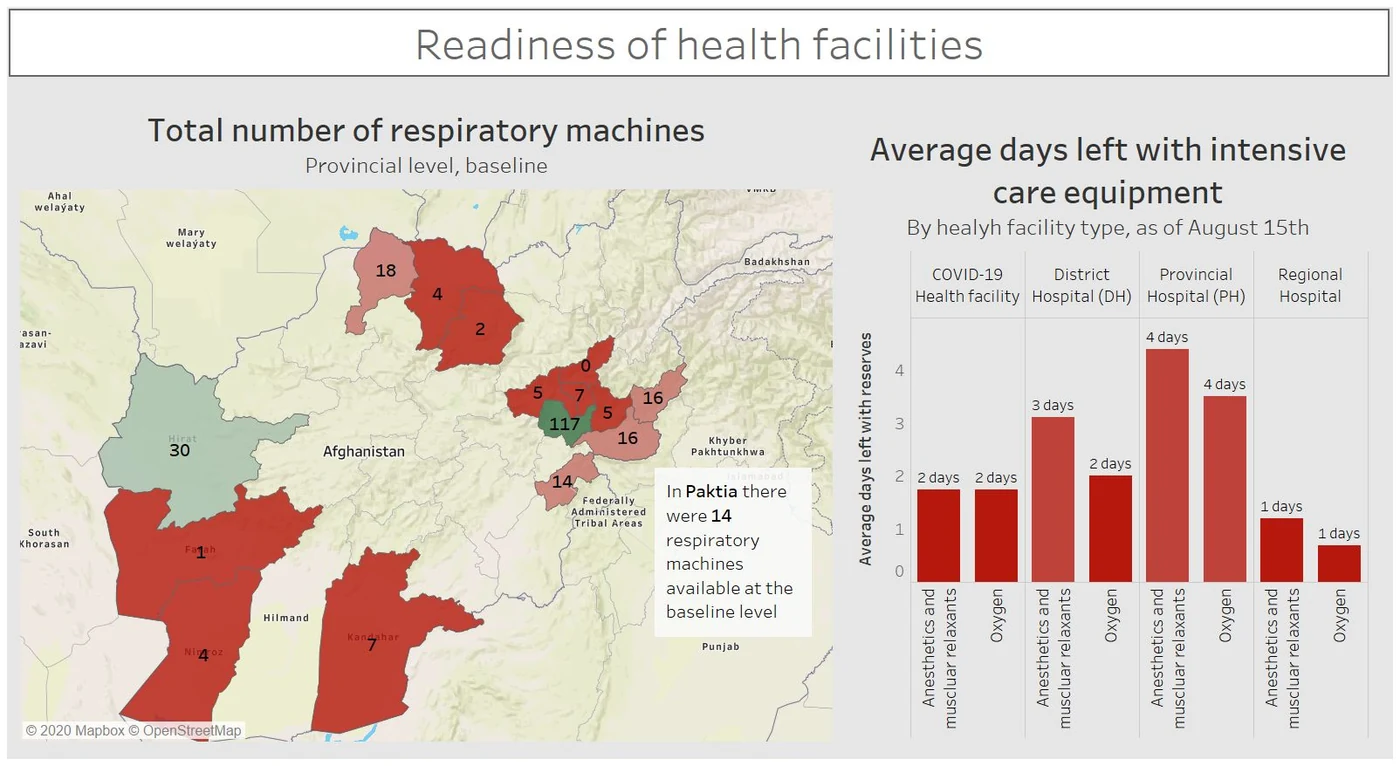
Conditions could be compared geographically.
Maps and operational indicators made uneven readiness visible across the health system.
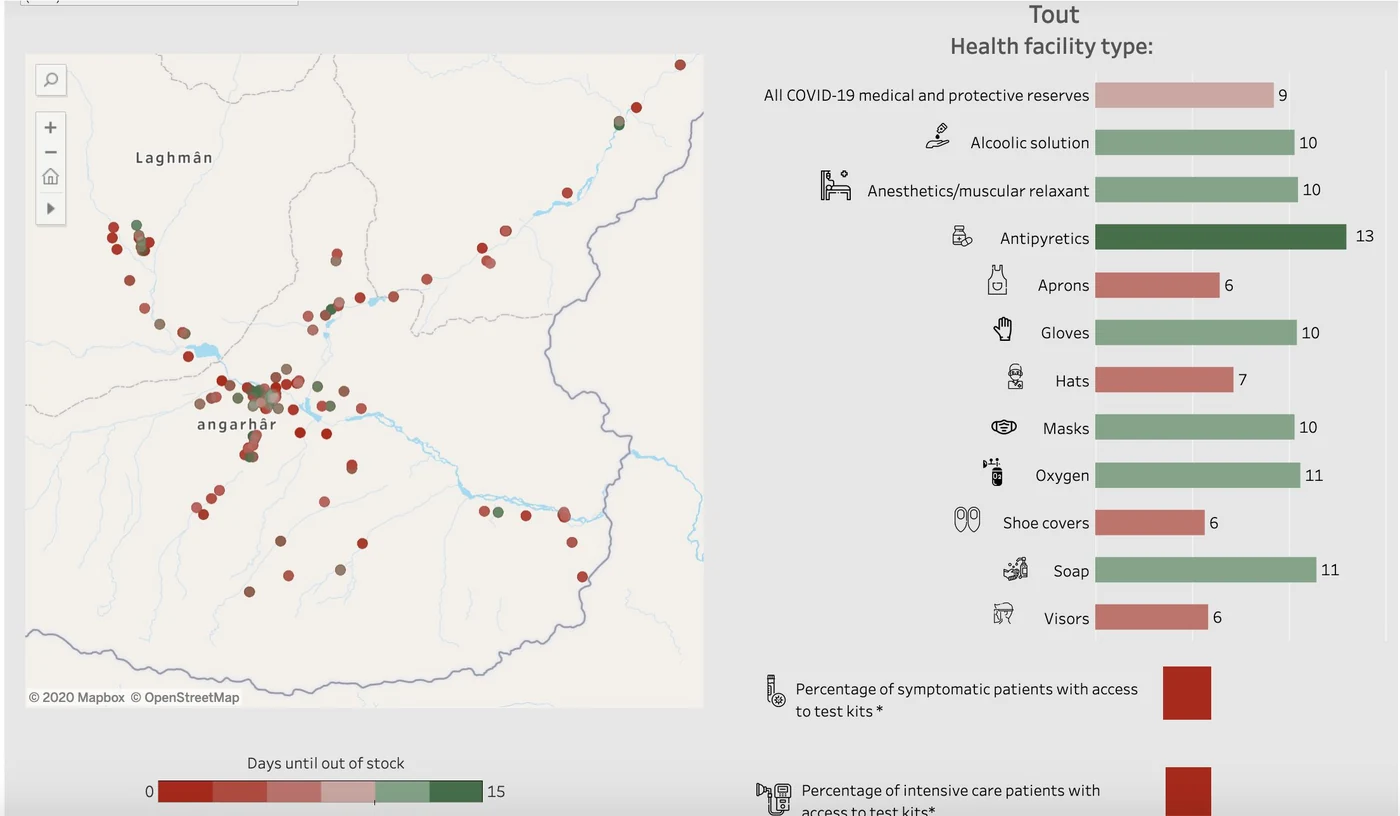
Place and operating data stayed connected.
Location, facility type and resource conditions could be read from the same operational picture.
A health facility stopped being a point-in-time record.
See one facility in context.
Current observations remain connected to the facility, place and evidence they describe.
Compare across waves.
The same structure makes differences in services, resources and operating conditions easier to see.
Follow change over time.
Later work starts with accumulated context, so change can be interpreted.
The evidence behind every answer.
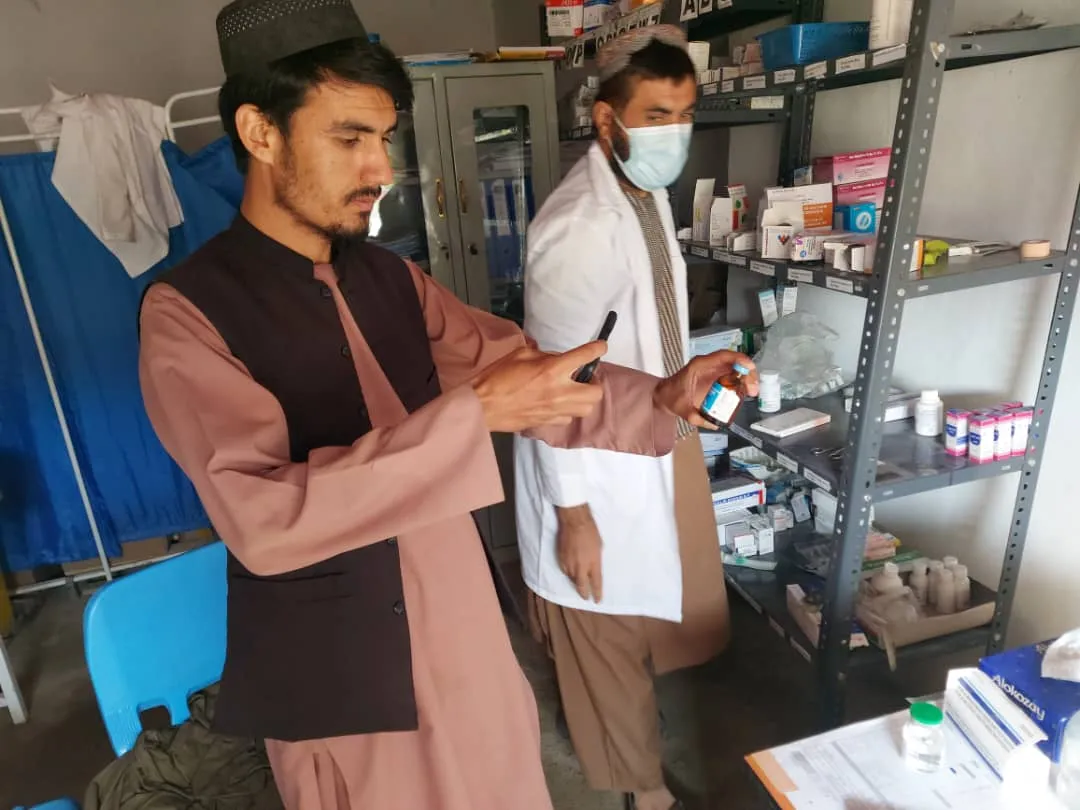
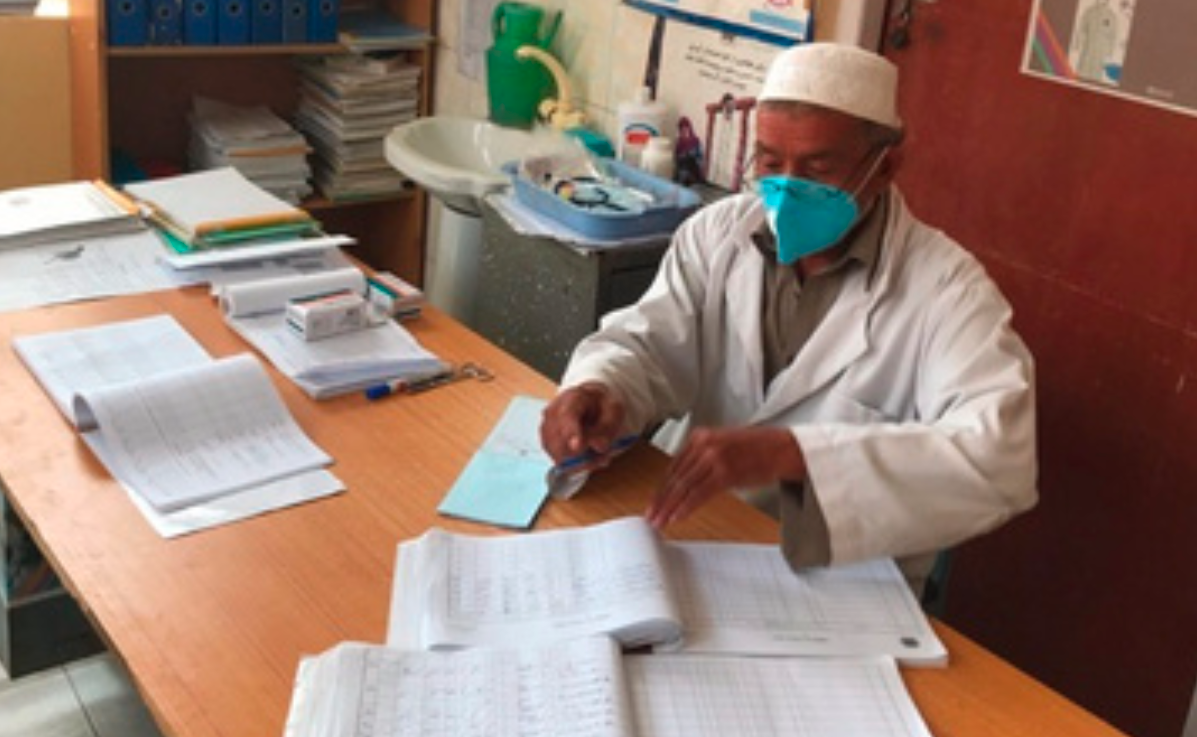
Field teams photographed what they checked on site: medicines, supplies and the records behind each answer. The analytical view stayed tied to these observations and to the people working behind them.
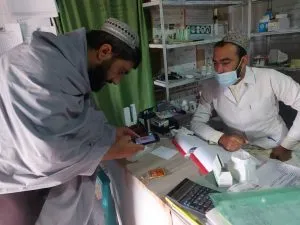
Answers entered on a phone, at the pharmacy counter. 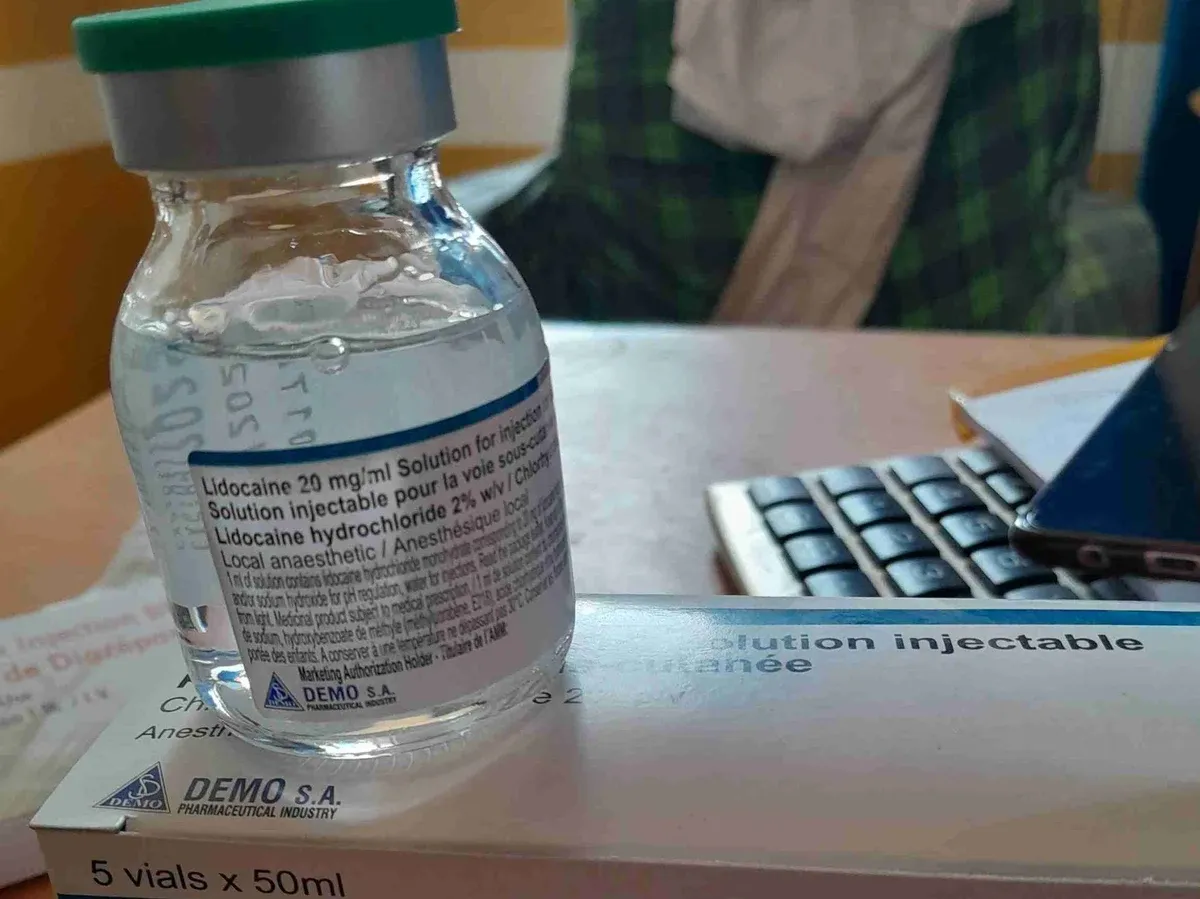
Medicine stock checked and photographed on site. 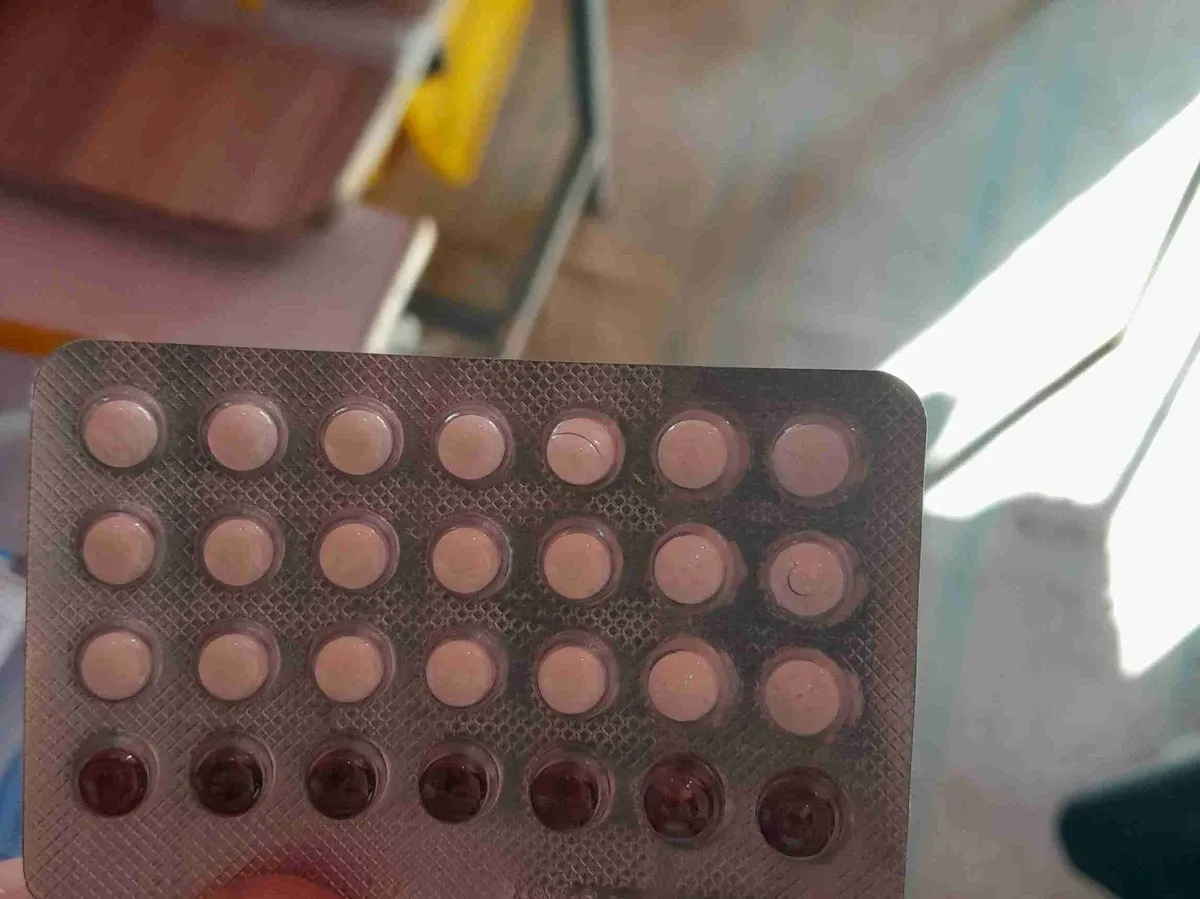
Each item counted, not estimated. 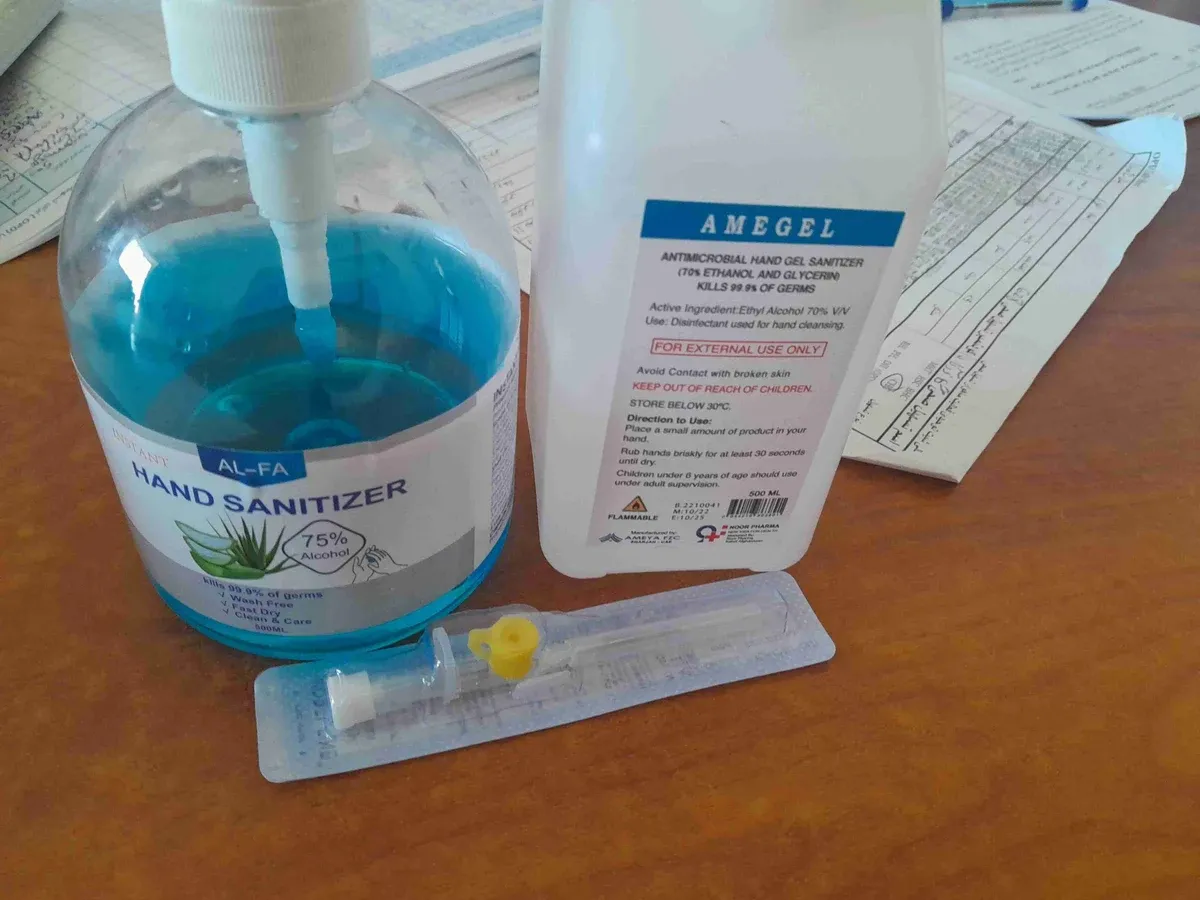
Hygiene and injection supplies, part of the readiness check.
The first wave built the reference. The next waves made change visible.
Each new round begins with facilities, observations and context that already exist, then adds another layer of evidence. Each new wave changes what can be compared, understood and asked next.
A facility picture exists.
Place, facility identity and structured observations already provide a common frame.
A new wave extends it.
New observations attach to what is already known.
Difference becomes evidence.
The same reference can now show what changed between periods and where that change occurred.
The next question starts from change.
Because history is already there, the next cycle can investigate why conditions changed, where attention is needed or what should be compared next.
One reference, accumulating history.
- Service change
- Resource availability
- Operating conditions
- Facility comparison
- Priority questions